it’s Not The Defense, Stoopid.
Quizes are very popular these days. I think I’ll run one. Okay. Here goes:
Q1: Arsenal are shit at defending. Correct?
A) True
B) False
C) Marshmallows are tasty
Q2: What place does Arsenal rank in the PL at this point in the 12/13 season based on Total Goals Conceded?
Select a ranking for Arsenal in the table between 1 and 20 where 1 is the best (fewest conceded) and 20 is the worst (most conceded)
Q3: All right. Maybe you smell a rat and you have decided Arsenal’s total goals conceded is really quite healthy but our goals conceded off corners and free kicks ie set-pieces must be its usual dismal self. Arsenal uses Zonal Marking for corners, so that’s obviously a catastophe. So…
How many goals have Arsenal conceded directly off corners in the EPL this year?
Pick a number: Write that number down.
Q4: How many Free Kicks have Arsenal conceded from, directly or indirectly?
A) 1 or 2
B) 3 or 4
C) 5 or 6
D) 7 or 8
Q5: What percentage of our Goals Conceded comes from Set-Pieces?
A) 12%
B) 17%
C) 22%
D) 26%
So here are the answers…
Q1: Arsenal are not shit at defending (this year.) Piss off.
Q2: Arsenal have conceded a total of 35 goals this season, ranking us 2nd best alongside United and behind only City.
Q3: Arsenal have conceded off 2 corners in the EPL all year. against Fulham at home and City away: Berbatov and Lescott.
I had a lively debate with someone who shall remain nameless who went off on a rant about Arsenal having no clue about defending corners and set-pieces, that Zonal Marking was shit, and that we would never practice defense anyway. He is wrong.
Now there were another 2 goals that followed from a 2nd phase after the corner. There was the Evra goal at OT, where they worked a clever short corner, and there was the Collison shot from outside the box from a cleared corner. Neither of them are classed as “conceding from a corner” statistically, but clearly they do relate to defensive work at set pieces.
Q4: Free Kicks? We must have leaked like a sieve! After all, just from the 1st Chelsea game there were 2, and the season had barely started. Total number of goals from Free Kicks was… drumroll……..4, all at the Ems: the 2 at home to Chelsea plus 1 each at home to Newcastle and Norwich.
Q5: So that’s a total of 6 set-piece goals we conceded from out of 35 goals so far this season. Basically 1 in 6. Or 17%.
The Blitz
And of course, we must remember the performance at Sunderland, when Arsenal were reduced to 10 men, and then endured something like 40 crosses and corners in the latter stages of the game, and yet somehow valiantly protected the goal. The onslaught was such that half way through the bombardment, the Queen Mum showed up to do a quick tour and inspection, have a chat with some of the locals, and raise spirits by sharing a cup of tea and a kind word. Lovely lady. Then she scarpered off back to the Palace with old King George and left the lads to it again. Clearly seen in the photos are a couple of the buses we parked, as well an unexploded V1 Bomb launched by the enemy.


Bayern and Dortmund – Corners (and Set-Pieces)
Speaking of the Germans, it did cross my mind as one more point of pride that we received a lot of criticism for daring to concede a goal off a corner against Bayern Munich in 1 of the 2 CL matches. Did anyone watch the number of corners and free-kick crosses that both Bayern and Dortmund profited from against Malaga, Barca and Real?? Correct. A lot. They provided their critical goals in fact. And WE allowed 1 goal off a really well taken corner? But we scored off 2 corners. I think someone owes someone a bit of an apology in light of recent results in the CL. You know who you are.
Where This All Started
Now, actually the main trigger for this blog was the following tweet:

It reminded me of something Wenger has said a few times in the last couple of years. I couldn’t find the quote but if you have it, please send it to me. It was something along the lines that the PL has gotten more attacking and that attackers have gotten better.
So the first thing I did was project a year end total based on the current Goals Conceded run rate for Arsenal to see what our total looks like for the full ’12/13 season. It extrapolates to a total of 39 goals conceded by Arsenal. If correct, that will be 10 goals better than 11/12 but still nowhere near the total of 31 for Arsenal in 05/06 or 07/08.
So what gives? Was it just us? Or was the PL in general following a similar curve so that all boats were rising and falling on the same tide.
The answer to that question? When you look at the numbers as we will, I’d break the answer into 3 parts. I could show you lots of tables and we would probably all lose the plot so let me summarize the easy bits. Wenger was right. The whole league is scoring more goals and therefore conceding more. I have lots of graphs to show you on that in a minute.
Also, Arsenal performed as you would expect. I checked a couple of things. Where did we finish on Goals Conceded at the end of the season?: We finished within a place of our EPL ranking typically. apart from 2 years. 11/12 was our worst with an 8th place ranking on Goals Conceded. But then I wondered, well if we check where we were placed in the middle of March BEFORE we have our frequent season end slump, how did we do. I thought that would be a better measure of our defensive capability, slumps aside. We did better was the answer. Generally our Goals Conceded ranking matched our EPL ranking. . It would be great if it were better, but this is an attack-minded team and it’s challenging to get both right at the same time. Of course, if we are going to contend for the title that’s exactly what we’ll have to do. But we will still most likely be more attack than defense-oriented.
So, what did the data for the PL as a whole show? Let’s look at the last 14 seasons. And again, I have extrapolated the results for 2012/13 to bring everything up to date and relevant.
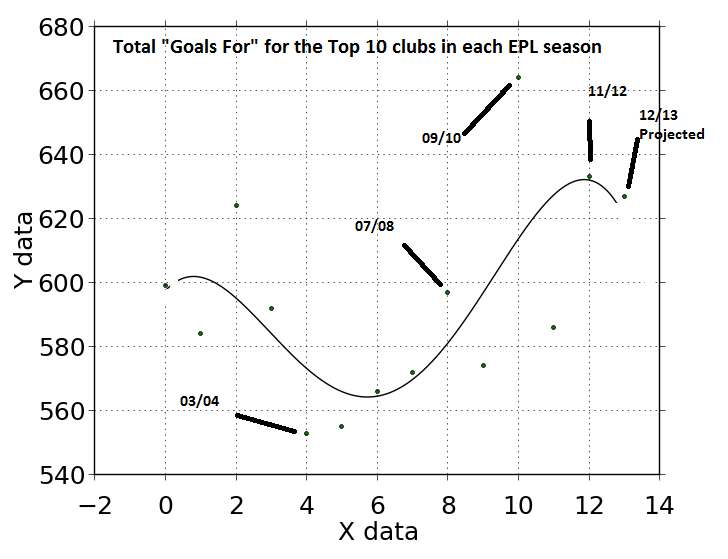
GOALS SCORED BY THE TOP 10 CLUBS each season
I focussed on the Top 10 Clubs to analyze the data. This is the neighbourhood we are in.
This first plot shows you how many goals were scored by the Top 10 teams in the season. Basically you add Man United’s total to City’s and Chelsea’s and Arsenal’s etc etc.
The Top 10 teams have gotten a lot more scorey over the 14 seasons studies. But it is a U-shaped curve. At the start of the decade goal-scoring was high. Then it dipped for the middle years only to rise even higher at the end of the decade and into the new decade.
There were a couple of outliers on the GOALS FOR chart, notably ’01/02 and 09/10 on the high side. 09/10 in particular was a killer year. 11/12 and 12/13 seem to have stablized for now.
Conversely the year of the Invincibles was a low point for GOALS FOR among the Top 10 clubs.
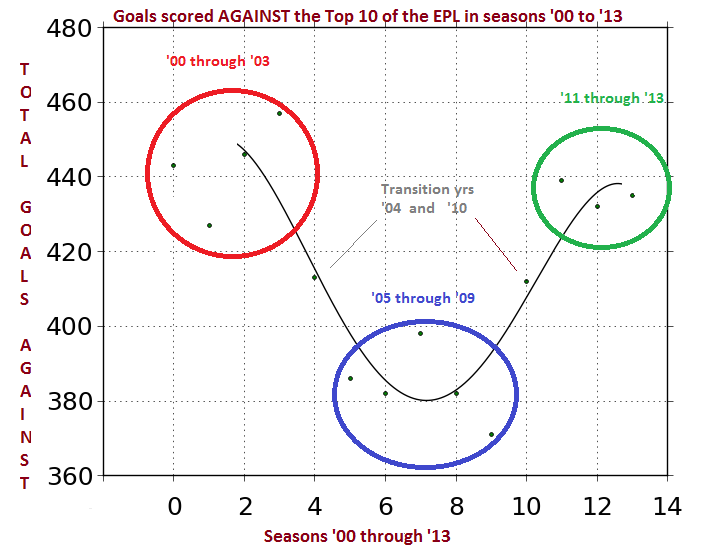
So the GOALS FOR increased after first taking a big dip. Obviously we expect the GOALS AGAINST to increase too. It follows a very similar curve to the GOALS FOR. It is somewhat fun to compare each year on the 2 charts and try to correlate. What you can see is the the Top 10 clubs have gotten much better at scoring over this period. And yet after a big improvement in the ’04 to ’09 seasons for conceding goals the PL has gotten steadily worse year after year since then.

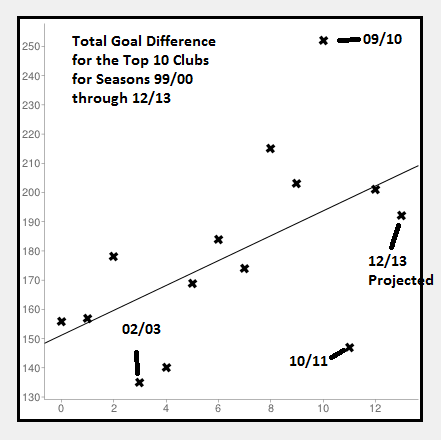
After doing this for a little while I decided it would be interesting instead to check out a GOAL DIFFERENCE chart. But this GOAL DIFFERENCE chart told a different story. It didn’t have a U-shape at all. If anything it seemed to rise over time, regardless of the fact that the middle years should show a narrowing of the GD total.
What was this telling us? I think it’s saying that throughout this 14 year period, the number of goals that the bottom 10 teams absorbed kept increasing relatively, regardless. And therefore that the gap in quality between the top half of the table and the bottom half has generally widened despite the fact that goal scoring went down before it went up again to new heights.
Above I show the Goals For and Against side by side to make it easier compare the shapes. Goals For has a decided overall net increase at the end. Whereas Goals Against ends up a little lower than where it started. This is consistent with an increasing GD over time for the Top 10.
Below, I attempt to group the eras of high and low goal scoring, as well as identifying transitional years.
GROUPING THE 3 PERIODS
GOALS FOR:
This is my favourite way to highlight the trend between the 3 periods:

GROUPING THE 3 PERIODS
GOALS AGAINST:
And again, this is my favourite way to highlight the trend between the 3 periods:
Let’s do a side by side: GOALS FOR Trend vs GOALS AGAINST Trend.
Here is the ARSENAL data for Goals Against. You can see a similar shape to the general trend though it does imply loss of ground to the pre-Invincibles era, reflecting a loss of dominance from the period where we cam 1st or 2nd each season.

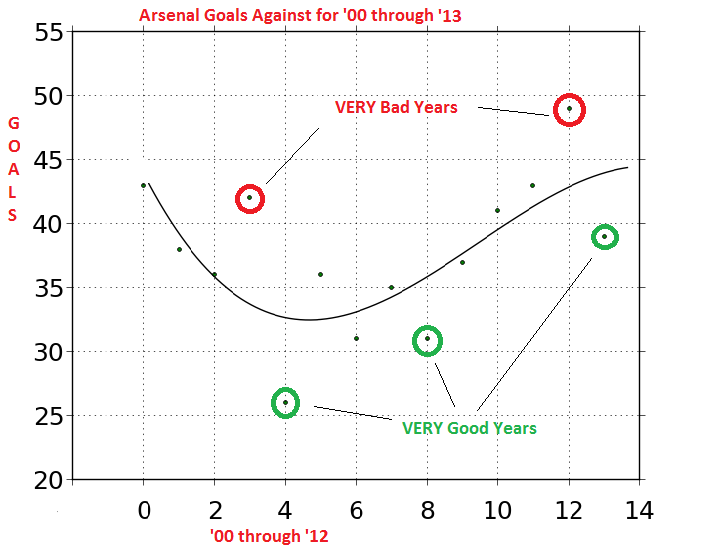
So, in general, Wenger is right about the trend towards more goals being scored and conceded across the league especially in the Top 10. It doesn’t explain every aspect of Arsenal’s defensive record. We have had a couple of particularly shit years eg 09/10 and 11/12 compared to our finishing place or interestingly if you look at our trend line in fact you would highlight 02/03 and 11/12 as being the poor performers against our trend line. Hopefully, it does give the context in which to judge a worsening defensive record every year because the same thing is happening to the Top 10 Clubs on the average ever since 2003/04 and 2004/05 but especially since the low point for Goals Against of 2008/09.
I hope this puts these stats in a clear context:
In summary, Yes,
- The Top 10 teams are scoring A LOT MORE GOALS
- The Top 10 teams are conceding A LOT MORE GOALS
- The Top 10 teams are scoring disproportionately more goals than they are conceding
- Therefore the Bottom 10 teams must be conceding disproportionately more goals than before
- Wenger is correct in broad terms – attacking is winning the day
- Arsenal’s defensive performance this year will be extremely impressive if they keep this rate going and finish on 39 Goals Against total
A Dissonant Defensive Record This Year
Now, stop for a second and think how much more impressive still this year’s defensive performance is, to date. Imagine you didn’t know the stats but just judged our defense by its soap drama. We have seeen:
- Our centerback troubles for most of the season,
- relying on Santos and Vermaelen at leftback for a significant number of games,
- Sagna’s injuries and loss of form,
- Szczesny’s loss of form and our reliance on Mannone and then Fabianski,
- the lack of balance when Arteta and Jack are paired together,
- the fact that we didn’t buy the anticipated DM
…they all sound like plausible factors for a poor defensive season. I have to agree with myself here, it’s a surprisingly dissonant result this year.
Looks like somebody has been practicing their defense to me. What do you think? Is the defense perfect? No. Far from it. There is plenty of room for improvement, now that it has settled down with Per/Koz as the CBs.
And it points to the fact that it’s down the scoring end where our troubles lie this year. As we know, that is masked further by the fact we had a number of high scoring matches against lowly teams eg Newcastle, Reading etc. So, we have not scored a lot of goals this year, once you remove the high outliers.
Yes, this is the great irony for a Wenger team. Defense is good, attack is the problem.
Big Picture Hypotheses:
Talking about the broad PL trends again…What are the Potential Factors affecting the trend through the 14 seasons. This is off the top of my head. I would welcome your considered thoughts on this because I know I don’t have it all here…
- Shift from 442 to 433 variants initially slows down the goal scoring
- Arrival of the Oligarchs results in influx of talent and foreign players
- Increase in EPL and Commercial revenues also attracts talent
- The move away from a Makalele type DM to a playmaker like Busquets or Carrick
- A general shift to an attacking philosophy across most clubs
- Changes in the offside law to favour the attacker
- Changes in the application of the tackling rules etc., eg No Tackling From Behind, to favour the attacker
- “Improvements” in ball and pitch technology
- The compounding affect of annual dominance by an elite 4-6 clubs benefiting from repeated UEFA revenues
- The benefits of these changes have been felt more in the Top 10 teams than the bottom 10 teams
Like I say…let me know what other factors add to this.
Arsenal Gives Good Zonal. And So Did Rafa:
And just for kicks, here is a graph borrowed from Rafa Benitez to show that his Zonal Marking system worked on average better than Man to Man or as I call it, Anal Marking:
It shows the Goals conceded on set-pieces for the PL teams over a somewhat similar period, just as another yardstick for Zonal vs Anal Marking. It tells you that Arsenal’s goals conceded from set-pieces total is pretty good this year by any standard in any year. Arsenal gives good Zonal on corners.

And a few words from Rafa on Zonal vs Anal:
“It is always easier to blame the system and the manager with the zonal marking. With man to man marking, we blame someone and that’s it.
It depends on your players, how many are good in the air? Are they quick or just big lads? It it your keeper good in the air? It is not a simple answer. As always, it depends on the players you have because the man to man and zonal systems of marking have their advantages and disadvantages. The system should suit the players.
It shows that it should not be the system that is blamed for conceding goals at set pieces but it will always depend on the determination, concentration and ability in the air of the players at the moment of delivery of the set piece. The data certainly does not show that one system will always be better than the other. It is about using the right system for the right players at the right time. In fact, at Liverpool the zonal marking evolved through the years (under Rafa) to take in to consideration the changes in personnel of the team but still maintained the high success rate.”
And Finally
I don’t know if my assumptions and hypotheses are correct. This is just an opening gambit after a week of gathering data. Please feel free to add, correct and suggest. My understanding is still evolving on this. Educate me!!

Brilliant! Great Analysis, or should we say Zonalysis?
Well you lost me .
Lol. Everybody’s shitter. This year we’re less shitter than the rest. Other years, not so much.
In a free marketplace, agents who sell insurance would be able to reduce the cost of premiums to their QuotesChimp by voluntarily reducing their commissions, if the agents believe doing so is necessary to get the sale. Unfortunately, insurance industry in�terests oppose this freedom, and as a result many states have laws prohibiting such “rebates” to the consumer. In these states, efficient agents cannot lower commissions to compete better for a higher market share. Such laws are purely and simply anti-consumer, and they should be repealed.
Excellent work. My only regret is after doing the time consuming stuff (data-gathering, analysis and most of all, thinking of how and then make an effective the presentation of this information) some twat, usually with a preconceived bias against AW and our defenders, will declare the stats don’t tell the whole story. Well, I am impressed.
Ah yes, always the risk. Thanks mate!!
Seems to me the criticism of our defence is a bit over the top (could it be the media trying to sell a ‘ARSENAL IN CRISIS’ story and some of our fans falling foul of this??) We’re an attacking team (generally and we all like attacking football) so naturally our defence won’t be record-breakers over a season but on the whole they do alright and the positioning is usually all good, just sometimes we lack ‘a little bit quality’ and make some bad mistakes. I think we have the right idea on the pitch, just need to improve on it.
Good work on the blog mate!
Thanks mate. Our defense, like almost every other team could do with improvement almost every year. But criticism is usually well over-stated.
Enjoyed today’s blog post. I think I enjoy the ones that showcase your wit and biting sarcasm more but I have to commend you on all the hard statistical work that went into this piece.
IMHO Kos, Mert and Ramsey (At this point it goes without saying that Arteta is constantly solid) have been outstanding the past few months and have had a great deal to do with the team’s good form and strong defensive record.
Cheers
P.S. Lets beat the shit out ManU tomorrow and make RVP’s inner child cry like a bitch!
Thanks, mate. Understand your preference there mate. But my muse whispers and I do the writing.
Thanks for following
Excellent analysis! I love analysis backed up with data. Top class stuff mate!!!
Had to re-read it all to take it all in. That is some heavy number crunching Mr Pimp!
Found only typo – didn’t you meant the Away game at Sunderland when we went down to 10 men and defended a goal lead like it was Helm’s Deep?
Also no mention of Diaby being out of the team twice this season. We were relying on him to be a massive player in midfield.
A certain mr Martin Keown commented that Arsenal need to get back to conceding less than 30 goals in a season to be title contenders. Your analysis suggests we might get away with a couple more, the scum are at 36 already and €ity are at 29. We are at 36 and Chavs at 35.
We have a habit of conceding slack goals when we are 4-0 up and the game is won, and the other type of goal we give away too often is a large number of individual dumb errors out of nowhere.
Fantastic blog, first time I’ve been on it (someone linked to it from goonerholic.com). Great writing style too, wish I really could “educate you” but I’m the one who’s learning here!
Great article, loved the math and graphs, right up my alley (:
Our record this year really is amazing when you put it in context (missing players)
Credit to Bould?
1) How about we correlate points vs goals conceded? So for example, if we lose 4 one-nil games in a row yet if we won the next game 10-nil, on average, we’d have ‘outscored’ the opponents by 2 to 1 yet going home with only 3 points in 5 games?
2) Same principle as 1) , Are we chokers? Do we only score loads when we’re winning? Say, we score nowt for a few games when we’re drawing, yet as soon as we score one, we go for it and score loads more? This would seriously skewer the goals stats.
3) Do we only win against out of form teams, and lose against in form teams? (It’s a bit paradoxical, as in form teams are no longer in form once you beat them) but do we really only bully the sick and disabled, yet cower against the big and healthy?
4) I seem to think that we hardly score against the top 4 oppositions, if true, it would make my point of us being chokers all the more conspicuous.
Great post man, but damn, I have an exam coming up and now you’ve hijacked all my brain power!!!
agree w the hypothesis that you’re suggesting. possession football w high defensive line is gaining popularity these days. guarantee more goals, but at the same time leaves the team exposed to counter threat. without the right player, is very dangerous to play this type of play. i dont agree to this style being applied at ALL TIME by AW w/o seeing who we up against with. you cant expect a RvP result from a giroud. diff player requires diff type of gameplan.
Wow science and maths!!
There is a saying you loose half of the readership of an article every time a graph or equation is used. A journo who never did maths said that.
Dead right analysis there mr PIMP and the art of defending is getting harder as more of the advantages go to the attackers ( quite rightly).
Excellent post debunking some pre-conceived notions that we have, its amazing how much influence so called MOTD commentators and media can have on our opinions. Our defense has definitely improved as the season has progressed and more so in the last few games. However I did come across a stat that was a bit concerning and that needs to be addressed in the long term, my guess is that it should get sorted out by next season.
We are the joint highest (tied with Wigan) for goals conceded from individual errors numbering 14.
Only three teams have conceded more penalties (6) than we have.
While we have had high scoring games that have skewed the GD in our favour, its not impossible to surmise that we would be placed for a comfortable finish if we could reduce errors and penalties conceded by at atleast 50%. I don’t have actual stats of what our position would be but I am hazarding a guess by saying that we would have take a few more points in games we either lost or drew.
We have there genuinely good and consistently fit centre backs for the first time in ever so many seasons. In bringing in Monreal we have added a bit of defensive steel to the back four and Gibbs, I think, has been less prone to injury this season. That Sagna has managed a whole season without breaking even one leg is also handy.
The answer to everything is 42
Great article. People can be so lazy with their remarks about our defence. ‘Per isn’t any good because he has no pace’, ‘we always concede from set pieces’ etc. Many form their opinion from shit punditry and don’t actually know what they are talking about!
Again great article, well done!
01110010 01100101 01110011 01110000 01100101 01100011 01110100
What about how much we ‘ missed’ rvp? Almost exactly the same goals scored but by 4/5 different players. Much more balanced even if the actual goals themselves are less spectacular.
Mda
Pingback: Squeaky Sphincter Time | Poznan In My Pants
😦 ma maah. im scared of degree cosined powered – graphs